中級者向けggplot2でこんな図が描きたい - 地図編
どーも。ggplot2は空手の一種として知られているので(要出典)普段の稽古が欠かせまん。今年を振り返り、ggplot2での作図について、いくつかの知見を共有します(書いている余裕がなかったんや...)
library(magrittr)
library(jpndistrict)
## Loading required package: jpmesh

## This package provide map data is based on the Digital Map
## 25000(Map Image) published by Geospatial Information Authorityof
## Japan (Approval No.603FY2017 information usage
## <http://www.gsi.go.jp>)
library(sf)
## Linking to GEOS 3.6.1, GDAL 2.1.3, proj.4 4.9.3
library(tidyverse)
## ─ Attaching packages ───────────────── tidyverse 1.2.1 ─

## ✔ ggplot2 2.2.1.9000     ✔ purrr   0.2.4
## ✔ tibble  1.3.4          ✔ dplyr   0.7.4
## ✔ tidyr   0.7.2          ✔ stringr 1.2.0
## ✔ readr   1.1.1          ✔ forcats 0.2.0

## ─ Conflicts ─────────────────── tidyverse_conflicts() ─
## ✖ tidyr::extract()   masks magrittr::extract()
## ✖ dplyr::filter()    masks stats::filter()
## ✖ dplyr::lag()       masks stats::lag()
## ✖ purrr::set_names() masks magrittr::set_names()
library(ggimage)
ggplot2で複数の図を一枚の図にまとめる方法あれこれ
図の中に小さな図(サブプロット)を配置する
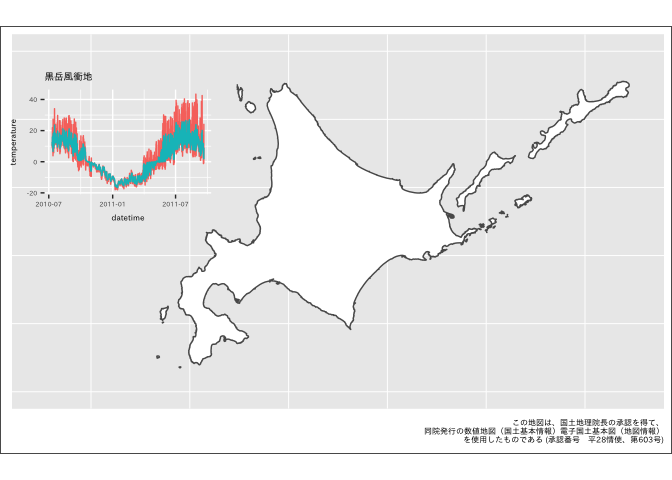
こんな図を作りたい。

これは最近あった案件なのですが、やってみると結構手こずりました。また、作業のあとにggimageパッケージの更新があり、こちらの関数を利用するともっと楽になることが判明しました。残念。
自分がやった方法とggimageパッケージの利用例をそれぞれ示します。まずはオレオレから。
地図データは国土交通省 国土数値情報の提供する行政区域データ(国土地理院発行の数値地図(国土基本情報))となります。また、地図と合わせて掲載するデータを環境省 モニタリングサイト1000のページからデータをダウンロードしてきます。
# 北海道のShapefile 国土数値情報
# 行政区域データを利用
sf_pref01 <- jpndistrict::jpn_pref(1, district = FALSE) %>%
    st_simplify(dTolerance = 0.001)
まずはベースとなる地図を描画します。あとでグラフを追加したいので領域を広げておきます。
p_base <- sf_pref01 %>% ggplot() + geom_sf(fill = "white") +
    xlim(137, 149) + ylim(41, 46) + theme(panel.border = element_blank(),
    axis.title = element_blank(), axis.text = element_blank(),
    axis.ticks = element_blank(), plot.background = element_rect(colour = "black"),
    plot.caption = element_text(size = 6)) +
    labs(caption = "この地図は、国土地理院長の承認を得て、\n同院発行の数値地図(国土基本情報)電子国土基本図(地図情報)\nを使用したものである (承認番号 平28情使、第603号)")
今回は作図するのが主題なので、データの読み込み等の処理は説明を省略します。ダウンロードしたファイルの読み込みと整形、作図のための関数を書いておきます。
x <- list.files("~/Documents/projects2017/monit1000/data-raw/KOZ02/",
    pattern = ".xls$", full.names = TRUE)
read_temp_xls <- function(path) {
    readxl::read_excel(path = path, sheet = 2,
        range = "A2:E10488", col_names = c("datetime",
            "above_temp", "below_5cm_temp",
            "below_10cm_temp", "notes"),
        col_types = c("guess", "text", "text",
            "text", "text"), skip = 1) %>%
        select(-below_5cm_temp, -notes) %>%
        gather(position, temperature, -datetime) %>%
        filter(!is.na(temperature)) %>% mutate(temperature = as.numeric(temperature))
}
plot_temperature <- function(path, ...) {
    read_temp_xls(path) %>% ggplot(aes(datetime,
        temperature, color = position)) +
        geom_line() + ggtitle(...) + theme_set(theme_gray(base_size = 12,
        base_family = "IPAexGothic")) + theme_transparent() +
        theme(legend.position = "none", text = element_text(size = 6))
}
これらの関数を使って、一気に作図まで行います。このデータは、 モニタリングサイト1000の高山帯調査で記録された、大雪山の黒岳風衝地における地温・地表面温度です。凡例をつけていませんが、赤い線が地表、青い線が地下10cmでの気温(摂氏)を示しています。
plot_temperature(path = x[1], label = "黒岳風衝地")

ではこの2つの図を組み合わせて行きます。これにはggplotGrob()とannotation_custom()を利用します。
sub_p1 <- ggplotGrob(plot_temperature(path = x[1],
    label = "黒岳風衝地"))
p_base + annotation_custom(sub_p1, xmin = 136.2,
    xmax = 140.6, ymin = 43.4, ymax = 45.8)

きちんと理解していないので適当ですが、このように、図中に含ませたい図をggplotGrob()でgtableオブジェクトに変換し、annotation_custom()で上乗せする、という方法です。annotation_custom()の引数で図の大きさ、配置を調整します。
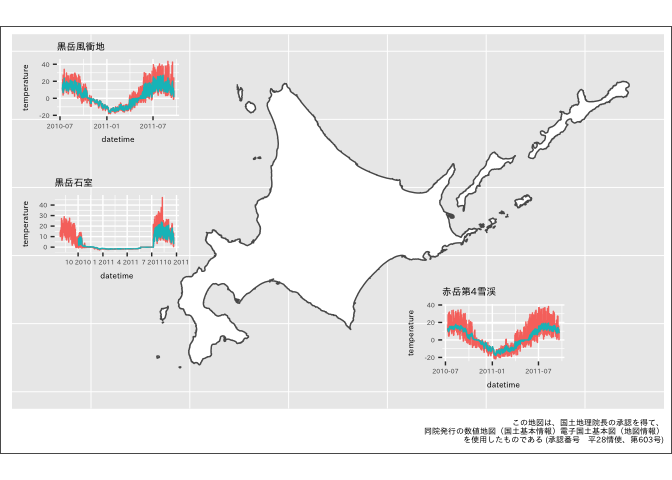
で、これだと図が多くなると手間ですよね。というわけでggimageを使います。私が作業する時には更新が間に合いませんでしたが、今度からはこっちを使いたいと思います。簡単です。
まずは図を用意しましょう。今度は3地点の図を一度に載せます。グラフの描画にもpurrrは便利ですね。
plots <- map2(.x = x[c(1, 5, 9)], .y = c("黒岳風衝地",
    "黒岳石室", "赤岳第4雪渓"),
    .f = ~plot_temperature(path = .x, label = .y))
# 個別の図はリストに格納されています
# plots[[1]]
ggimageのgeom_subview()はデータフレームに配置する座標や図を格納し他データフレームを展開します。そのためまずは図を配置する座標、サイズ、含めたい図のオブジェクトからなるデータフレームを作りましょう。
# plot変数にlistで図を格納する
df_plots <- data_frame(x = c(138.2, 138.2,
    146), y = c(45.4, 43.4, 41.8), width = 3.5,
    height = 1.7, plot = list(plots[[1]],
        plots[[2]], plots[[3]]))
これをgeom_subview()に渡します。
p_add <- p_base + geom_subview(aes(x = x,
    y = y, subview = plot, width = width,
    height = height), data = df_plots)
p_add

できたー!格好いい図が描けました。よかったですね。(軸が潰れてしまっていますが、一旦は無視してください)
出典: 「モニタリングサイト1000高山帯調査 地温・地表面温度調査」(環境省生物多様性センター) (http://www.biodic.go.jp/moni1000/findings/data/index_file_earth-temp.html)
この図におけるグラフデータは「モニタリングサイト1000高山帯調査 地温・地表面温度調査」(環境省生物多様性センター)を使用し、瓜生真也が作成・加工したものである。(http://www.biodic.go.jp/moni1000/findings/data/index_file_earth-temp.html)
沖縄を移動、南方諸島を省略した日本地図

さてもう一段。今日はRアドベントカレンダーなので2つ目のtipsです。
日本地図を描画する際、沖縄県や小笠原群島を中心とした南方諸島の島々の位置が気になることがあります。そのため地図の配置を変えるという試みがこれまでされてきているのですが、これのggplot2版というのは見たことがありません。
これもggimage::geom_subview()を使うとできてしまうのでやってみましょう。完成図は上に示したものです。
sf_ja <- 1:47 %>% magrittr::extract(-13) %>%
    map(~jpndistrict::jpn_pref(pref_code = .,
        district = FALSE)) %>% reduce(rbind) %>%
    st_simplify(dTolerance = 0.01)
sf_pref13 <- jpn_pref(pref_code = 13, district = TRUE) %>%
    st_simplify(dTolerance = 0.01) %>% mutate(city_code = as.numeric(city_code)) %>%
    filter(city_code != 13421) %>% st_union() %>%
    as.data.frame() %>% mutate(jis_code = "13",
    prefecture = "東京都") %>% magrittr::set_names(c("geometry",
    "jis_code", "prefecture")) %>% st_as_sf()
sf_ja_omit47 <- sf_ja %>% filter(jis_code !=
    "47")
sf_ja_pref47 <- sf_ja %>% filter(jis_code ==
    "47")
sf_ja_pref47$geometry %<>% magrittr::add(c(5.6,
    17.5))
sf_ja_pref47 %<>% st_set_crs(value = 4326)
p <- ggplot(sf_ja_omit47) + geom_sf() + geom_sf(data = sf_pref13,
    inherit.aes = TRUE) + geom_sf(data = sf_ja_pref47,
    inherit.aes = TRUE) + geom_segment(aes(x = round(st_bbox(sf_ja_omit47)[1],
    0), xend = 132.5, y = 40, yend = 40)) +
    geom_segment(aes(x = 132.5, xend = 138,
        y = 40, yend = 42)) + geom_segment(aes(x = 138,
    xend = 138, y = 42, yend = round(st_bbox(sf_ja_omit47)[4],
        0))) + xlab(NULL) + ylab(NULL) +
    theme(plot.caption = element_text(size = 6)) +
    labs(caption = "この地図は、国土地理院長の承認を得て、\n同院発行の数値地図(国土基本情報)電子国土基本図(地図情報)\nを使用したものである (承認番号 平28情使、第603号)")
p
いいですね。Enjoy! 時間がなくてコードの説明が足りていないので、後ほど追記します。